1/13/24
Technical and Analysts' Charts
I will be adding some articles from my patreon site on this page. Visit my patreon site @ https://www.patreon.com/myinvestingandtrading. I have articles from this website and more articles like the ones on this page. 7 day free trial and $3 per month for a paid membership. It is free to be a member, get notifications of articles. More is included with a paid membership.
Recent Articles
1/20/2024 CAT - Technical or an Analysts' Chart
1/13/2024 PBA - Technical or an Analysts' Chart
Important Links!!!
M1 Finance
- Free Investing, fractional shares, high yield savings, retirement investing, taxable accounts, You could receive $250 or more to invest. ROTH Portfolio
- This link shows all 52 holdings within the stock/etf portfolio, asset allocations, dividend yield, expense ratio, and performance 72 Holding Portfolio
- "The Beast with 71 Heads" - This link shows all 72 holdings within the taxable stock/etf portfolio, asset allocations, dividend yield, expense ratio, and performance. Tradingview
- Stock charts and more .Tradingview
- Free, Stock charts and more
jeremiah006's Investing Group - Discord Chat Room/Server - (It's working, but I will need to set it up.) Barchart
- Lots of free investing stuff, Custom columns for data.

Technical Analysis for Beginners:
Take $1k to $10k Using Charting and Stock Trends of the Financial Markets with Zero Trading Experience Required Paperback – July 16, 2021 by A.Z Penn (Author)
As an Amazon Associate, I earn from qualifying purchases. If you buy anything, including items not for sale in the store, then I earn a small commission. I am not the seller of items in my store.
Check Price on Amazon
1/20/2024
CAT - Technical or an Analysts' Chart
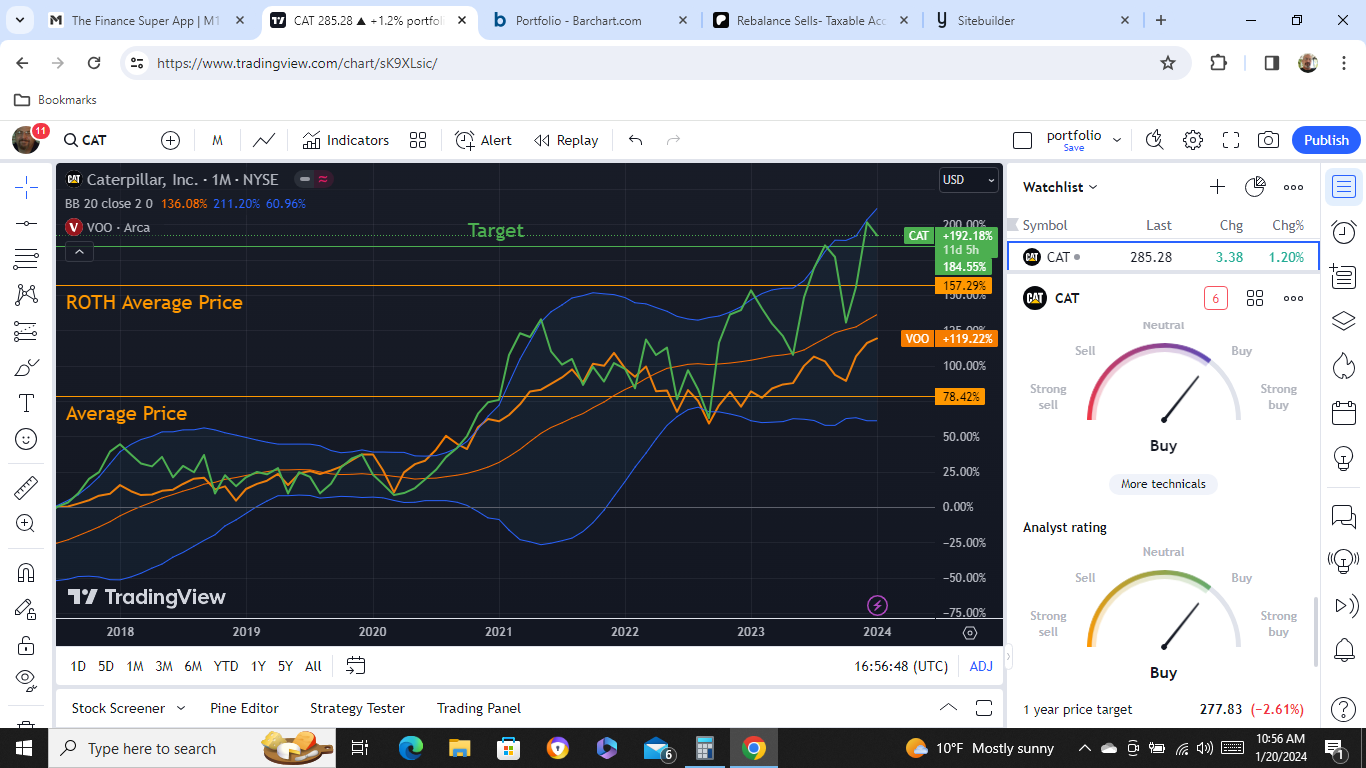
I am going to be doing a rebalance sell of CAT in the ROTH account on Monday. It is my highest value 1% allocation holding. My current unrealized gains are 10.45%. If I rebalance this holding, then my average price will be lowered. I only rebalance a holding if it has positive unrealized gains. The chart is from tradingview The price of this holding has started to bounce back down from the upper blue bollinger band. It is overvalued according to analysts' average one year price targets.

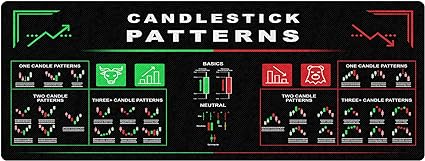
Bull Vs. Bear Candlesticks Reversal Indicators
Stock Market Education, Day Trader Gift, Crypto Gift, Trader Investor Gift, Mouse Mat Large Gaming Pad for Mouse and Keyboard Mouse Mat Pad HG
As an Amazon Associate, I earn from qualifying purchases. If you buy anything, including items not for sale in the store, then I earn a small commission. I am not the seller of items in my store.
Check Price on Amazon
1/13/2024
PBA - Technical or an Analysts' Chart
I am auto investing into my ROTH account, but I do like to look at charts of my lowest values or my most underweight holdings, which will be holdings that auto invest will buy. PBA is currently my lowest value holding. The monthly chart compares VOO to PBA, including dividends. PBA currently has a 14.37% higher one year average price target according to analysts. It does underferform, but if you pick high dividend holdings then you are investing for income. PBA currently pays a monthly dividend of 5.72%. It is a Canadian pipeline asset with no K1, but foreign taxes are taken out of the dividend. The total yield of this portfolio is 2.53% and 69% of the portfolio has a lower yield, so I do own growth and high yield. Another 14% of my portfolio is in assets with a higher yield then PBA.


